Convenience Functions
Plot
ADAF provides an easy-to-use plotting subsystem that supports both static and dynamic plots as well as different types of visualization. Plugins may use ADAF SDK to create new plots and add plot curves to them. ADAF GUI takes the responsibility of configuring and visualizing plots and curves in a user-friendly manner.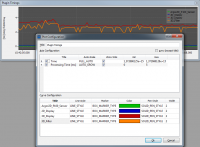
2D Visualization
Images of all common formats can be displayed using the 2D display plugin. This plugin is fast and provides a number of features like color maps, normalization, zooming, gamma-correction etc. The 2D display plugin can be overlayed with graphical elements. This plugin is part of both ADAF Basic and Professional packages.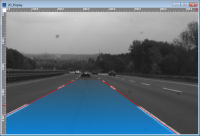
3D Visualization
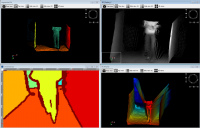
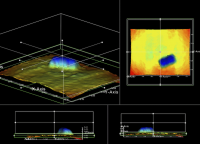
The 3D display plugin takes point cloud data and produces a 3D representation of it. User can navigate through the scene, adjust lighting properties and other visualization features. These include- Triangulation of the point cloud data
- Overlay of the 3DData with 2D image data
- Various color maps
- Various color schemes
- Interactive definition of volumes of interest (available in ADAF Professional only)
Properties
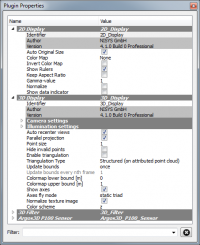
These provide a variety of settings. Each plugin can provide any number of properties as configuration options. The configuration management (load/save) is done by ADAF. There are different types of properties. Here, only the most important one are listed:- a boolean
- a number (integer or floating point)
- a string
- a selection box
- a file or directory name
Performance Measurement
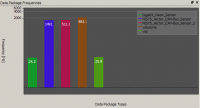
ADAF offers a choice of plots to measure performance.Data throughput
This plot shows the actual frequency with which the individual sensors provide data to ADAF .
Time measurement
This graph shows the respective processing time for each plugin. This makes it easy to see how parameter changes oder modifications to the source code affect performance. The most recently measured processing times are displayed as a curve.

Logging
Logging is used for simple output of status messages. It is possible to output messages with different degrees of importance and to filter the output according to these degrees.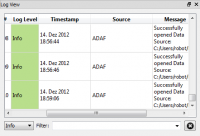
Recording / Playback
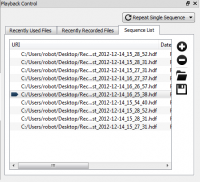
Sensor data from multiple different sensors can be recorded and played back. This happens with the help of the HDF-Recorder plugin which is part of ADAF Basic and ADAF Professional. This plugin uses the open HDF5 file format to record the sensor data with all the mandatory attributes. The recorded data can be reproduced in real-time or faster. The playback is not limited to HDF5 sequences. The C++ SDK allows the integration of other formats by implementing plugins.